Data is critical for companies that rely on high-stakes training, such as new employee onboarding, health and safety regulation compliance, for-profit courses, or client tutorials. The good news is, your company most likely has a mountain of data – both within Moodle itself as well as in external tools like spreadsheets. With the right tools, you can gain agency over your data and make it actionable. That’s where the IntelliBoard Learning Analytics Platform comes in.
Let’s say you run a company that sells widgets. All companies in the heavily regulated and notoriously cutthroat widget industry must show that all of their employees have passed a Widget 101 course and a Widget Certification Exam. Not doing so means failing an audit by the dreaded widget regulators.
At the very least, you need to know:
- Which employees are showing up for your trainings and who is on track for timely completion
- How employee performance in particular areas of your Widget 101 course correlates with the passage of the Widget Certification Exam
- Where each individual employee might be struggling so you can offer them the targeted support they need, when they need it
- All of the information required by the widget regulators in on-demand report form
Knowing what’s happening within Moodle and integrating this information with other data sources into easy-to-visualise reports can help you make fast and efficient directional changes that align with your goals.
Trapped in generic reporting? Meet the Visual Builder
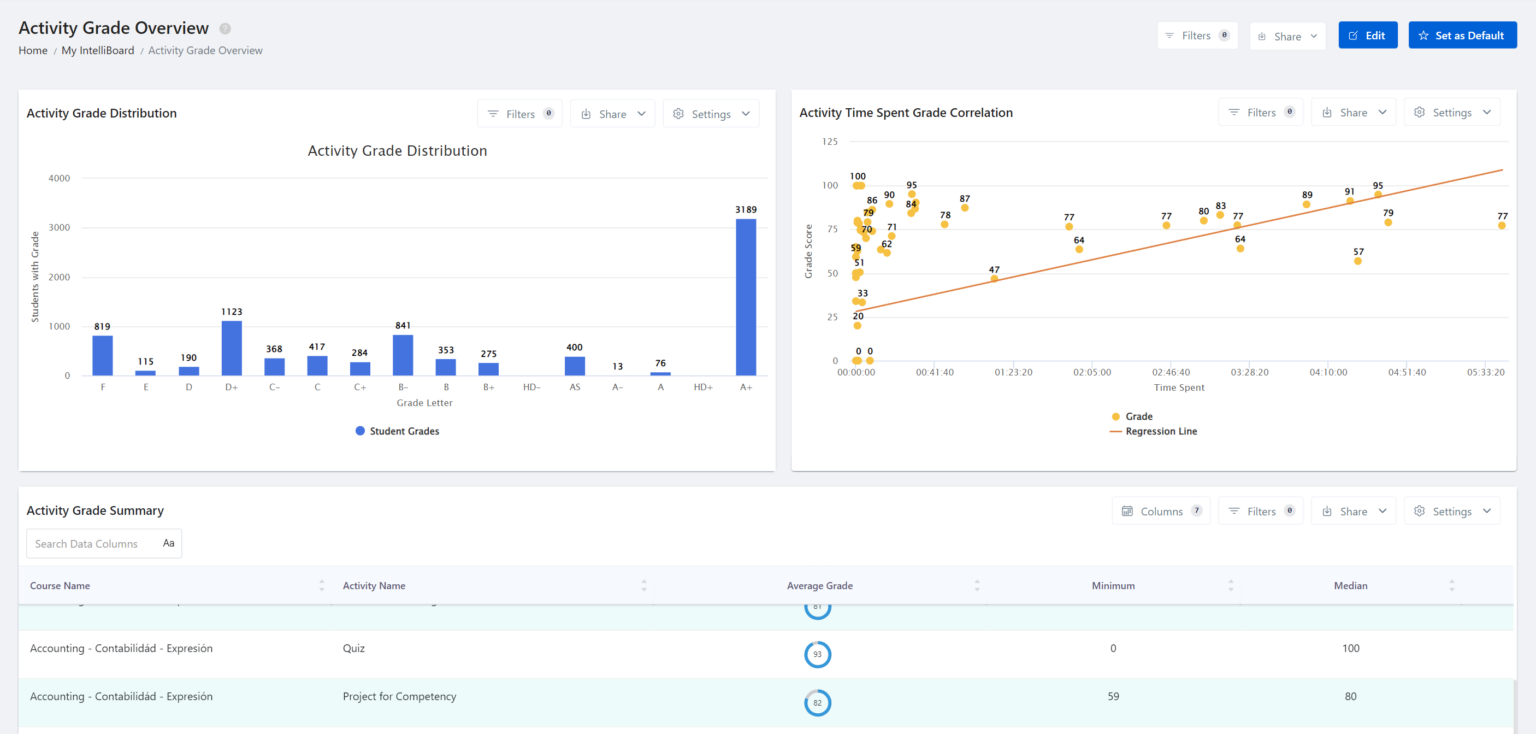
Data that’s easy to visualise is actionable. The IntelliBoard Visual Builder allows you to build your own reports, calculate additional fields, choose colors, modify column titles, manipulate order, and more.
Having the information that informs the quality of your training available on demand in easy-to-read customisable dashboards helps you see what’s working, what’s not, and what you need to do next to keep your trainings top-notch. IntelliBoard also allows you to share that data automatically with users who need it.
Your widget L&D team can use the Visual Builder not only to generate the reports needed to comply with regulations, but also to continuously integrate feedback into your trainings. You’ll know exactly which employees are on track to complete Widget 101 and pass the Certification Exam with flying colors. On the flip side, you can see which employees aren’t showing up or might need some help with certain portions of the course. Your days of being mired in a mountain of data are over.
Learn how a software company uses the Visual Builder to deliver better, more effective, and more engaging learning.
Got a lot of datasets? Bring it all together with InForm
You can further strengthen your training insights by combining other valuable data sources with learning data. The IntelliBoard Learning Analytics Platform is a straight-out-of-the-box solution that plugs directly into Moodle. With InForm you can also import data from outside of Moodle and manage it directly in IntelliBoard, relate it to system data, and use it in reports and graphs the same way you do with your Moodle native data.
What does this mean for your widget L&D team? Let’s say you brought in some employee data from HR to strengthen your training insights. Perhaps the employees in the Widget Assembly department are nailing all their Widget 101 coursework and assessments on the first try while those in Widget Sales are really struggling. You can tailor your Widget 101 training accordingly, perhaps even offering differentiated training based on department, employee experience, and previous training.
Quality assurance firm Testronic uses InForm to track internal learning and onboarding, streamline promotions and recruitment, and demonstrate the L&D team’s value to management. These data sets come from departments across the globe, but are all combined and leveraged within the IntelliBoard Learning Analytics Platform.
Struggling with compliance? Utilise InContact
InContact is the hub that brings communication together all on one screen. This feature provides totally customisable communication geared towards the competencies, job requirements, or licensing mandates relevant to your company.
Knowing someone isn’t showing up to Widget 101 or isn’t on track to pass the Certification Exam is all well and good, but to remedy the situation, communication is key. Financial Edge, a financial services training provider, uses InContact to schedule reports to go out to key players automatically.
In addition to these regular reports, you can set up conditional reminders for both your employees and their instructors to give them a nudge to stay on track and offer the help they need when they need it.
Need to mitigate risk? Leverage predictive analytics
You’ve collected your data and reports. You’re communicating your insights to your employees and training instructors. Now what? Generate predictions from your source data based on your organisation’s success criteria and use the Visual Builder to pull together any data you believe will help to predict key training outcomes. Initiate user notifications when at-risk behaviors pop up to mitigate negative outcomes.
Even without deploying machine learning or complex statistical analysis, predictive learning analytics can take basic data, like student attendance and engagement levels, and make robust predictions around what contributes to student success to provide incredibly high-value analysis. Check out IPAG Business School’s 4 Step Path to Success to take a deeper dive.
How does this apply to your Widget enterprise? Not showing up for Widget 101 might be an obvious risk factor for Certification Exam failure, but the volume and diversity of data you’ve collected allows you to go even deeper. Perhaps a low score on a particular assessment for members of the Widget Assembly department historically has spelled trouble. Performance on the same assessment doesn’t have nearly as strong an impact on Certification Exam passage for members of the Widget Sales team; a low rate of posting in the Widget 101 forums on the other hand is a harbinger of doom. Predictive analytics allows you to get granular with both identifying risks and turning them around with targeted interventions before they fully materialise.
Harness the power of your data to align your actions with your goals
The IntelliBoard Learning Analytics Platform makes your data truly actionable by bringing it all together into easy-to-visualise, customised reports, enabling you to communicate key pieces of information to the people that need to know when they need to know it, and applying the power of predictive analytics to gain even deeper training insights.
By measuring what matters most to you and your company, you can take your high-stakes training and your business to the next level.
Want to make your company’s data truly actionable? Download the IntelliBoard with Moodle plugin or take advantage of IntelliBoard’s webinars. IntelliBoard is Learning Analytics for everyone.